Smiling is the quintessential facial expression. The simple gesture can communicate honesty, friendship, and positive intent. But as basic and important as smiling is to social creatures like ourselves, it’s surprisingly easy to screw up. A misfiring grin can manufacture feelings of unease and distrust.
This conundrum prompts a question: What physical characteristics produce “good” and “bad” smiles? A team of researchers at the University of Minnesota just published a study with some answers.
To uncover those answers, Assistant Professor of Psychology and Statistics Nathaniel E. Helwig and his team took their research out of the lab, venturing to “The Great Minnesota Get Together,” the Minnesota State Fair. Setting up shop in the presence of prize-winning swine, carnival attractions, and food stands selling anything and everything fried on-a-stick, they recruited subjects of all ages and backgrounds, avoiding the WEIRD people that plague most psychology studies. The 802 participants who took part in the study were given an iPad loaded with a custom application. The app prompted each subject to rate fifteen random smile animations for their effectiveness, genuineness, and pleasantness.
There were 27 smiles for which data was analyzed. Each was altered based on three parameters: the mouth angle, the smile extent, and the amount of dental show (see figure below).
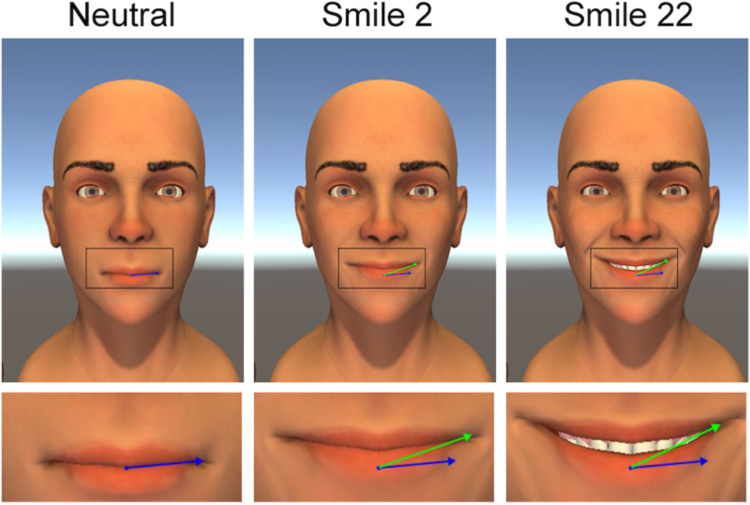
As the authors explained in their report, “Mouth angle is the angle between the green and blue lines. Smile extent is the length of the green line. Dental show is the distance between the lower and upper lips.”
So when all of the smiles were rated, what did the researchers find?
“The highest rated smiles were those with low to medium extents in combination with medium to high angles… successful smiles have mouth angles of about 13–17 ̊ and smile extents of about 55–62% the interpupillary distance [the distance between the center of the pupils of your eyes]. However… the best smiles represent a diverse collection of different combinations of facial parameters.”
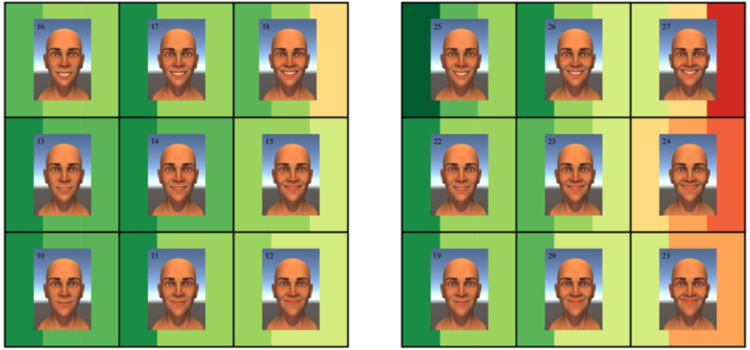
You can see this exemplified in the chart below. The columns of color in each individual square represent rating scores of effectiveness, genuineness, and pleasantness for each of the smiles. Dark green corresponds to a high rating while dark red corresponds to a low rating.
Smiles 21, 24, and 27 were three of the lowest rated smiles. All were sharply-angled and wide. Smiles 10, 13, 14, and 25 were in the “sweet spot” the authors discussed. Smile 25, which was sharply angled, narrow, and open, was rated the most effective overall.
While the authors carried out their study to help guide medical professionals treating patients with partial facial paralysis, the findings have broad use for anyone interacting in a social environment. But even if your smile doesn’t fall within the optimum window, the researchers don’t think you should fret too much.
“There is not a single path to a successful smile.”
The study was published in PLoS ONE.
Source: Helwig NE, Sohre NE, Ruprecht MR, Guy SJ, Lyford-Pike S (2017) Dynamic properties of successful smiles. PLoS ONE 12(6): e0179708. https://doi.org/10.1371/journal.pone.0179708
Leave a Reply